


Completed a 24-week program in Data Analytics & Visualization, with training in Python, JavaScript, SQL, Tableau, Big Data, Machine Learning, and Advanced Statistics.
- Analysis, design, and development of 3PL Logistics Reporting
- Maintenance and enhancement of the functionality of the 3PL Logistics Reporting
- Interaction with managers to gather functional requirements
- Documenting the design and architecture and keeping specification documents up to date
- Ensure systems are developed and deployed according to the functional requirements
- Manage data quality & integrity using Data Warehousing skills and databases (MySQL, Oracle, Microsoft SQL Server) & ETL tools like Informatica PowerCenter
- Perform comprehensive data analysis and reporting as well as customer research on existing or expiring contracts
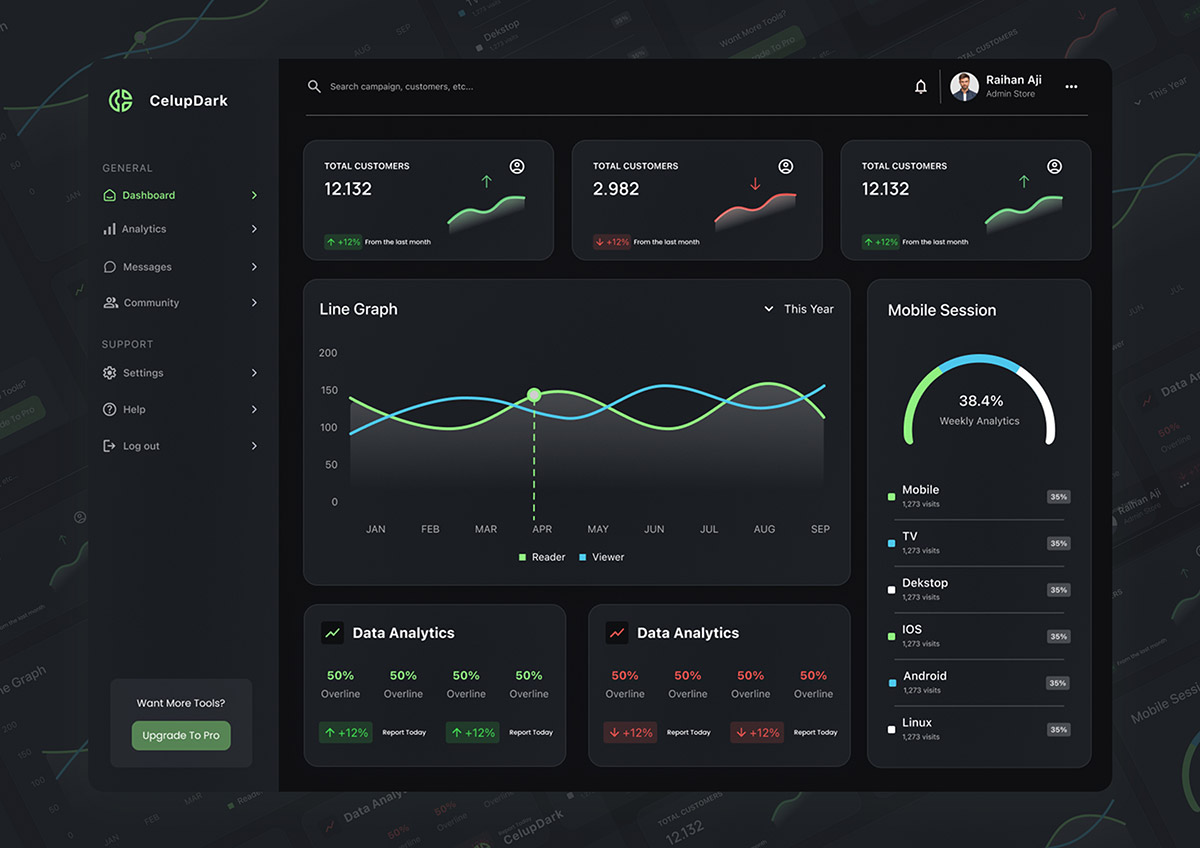
- Design and develop visualizations in Microsoft Power BI (v2.x) and Tableau (2021.x), including publishing reports and managing data sources on Tableau Server 2021.x for business and sales insight
- Design automated dashboards and data visualizations to extract relevant and targeted market insights; retrieve and analyze data by writing complex ad-hoc SQL queries across large-scale datasets and manage data migration across platforms
- Use historical data, sales trends and market research to develop forecasts and business strategy; provide reports on daily, weekly, and monthly cadences
- Develop proactive dashboards in Tableau (2021.x) and Power BI (v2.x) that provide leading indicators of high-risk areas and create action plans for teams and business partners to remediate quickly
- Develop meaningful analytical conclusions and recommend innovative solutions
- Define, track, and manage key performance metrics and insights across teams, programs, and business units on a regular reporting cadence; provide routine metrics and reporting that drive key decisions and actions


